I recently ran into the issue of changing how many ticks I want displayed on the x-axis in a holoviews plot. My data ranged from 0 to 100, but it was categorical in the pandas dataframe. Simple solutions don’t work in this case as categorical data can’t have the ticks changed easily in opts. Instead, I found this solution at: https://stackoverflow.com/questions/49460699/bokeh-plot-custom-categorical-tick-labels
Implementing it in my case allowed me to go from:
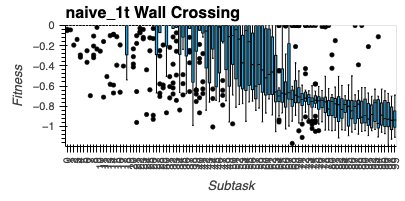
To this:
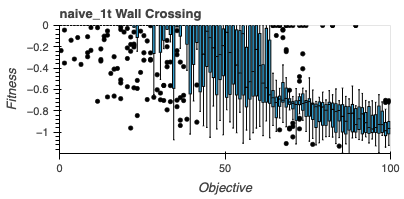
Code for the solution is below. Mainly, making the CategoricalAxis not visible and adding in a LinearAxis with FixedTicker did the trick.
import holoviews as hv

from bokeh.models import CategoricalTicker, FixedTicker, Ticker
from bokeh.models.formatters import NumeralTickFormatter
from bokeh.util.compiler import TypeScript
from bokeh.plotting import show
from bokeh.io import output_notebook, export_png
from bokeh.models.axes import LinearAxis
from bokeh.layouts import gridplot

def format_x_axis(p):
    # Remove default axis
    p.xaxis.visible = False

    # Add custom axis
    ticker = FixedTicker(ticks=[0,50,100])
    xaxis = LinearAxis(ticker=ticker)
    xaxis.axis_label = "Objective"
    p.add_layout(xaxis, 'below')

    return p

# Create a box plot to show how turning performs
def create_boxwhisker_custom_ticks(df, group_col, y_col, title, ylim=(-1.2,0)):
    boxwhisker = hv.BoxWhisker(df, [group_col], y_col).opts(width=300,xrotation = 90,ylim=ylim, title=title)
    return boxwhisker

plots = []
plot_width = 400
plot_height= 200

for t in wt_treatments:
    t += "_wt"
    filtered_df = wt_best_last_gen_per_rep_full_results_df[wt_best_last_gen_per_rep_full_results_df.Trt == t]
    filtered_df = filtered_df[filtered_df.Task == "wall"]
    wall = create_boxwhisker_custom_ticks(filtered_df, 'Subtask', 'Fitness', f'{wt_treatment_mapping[t]} Wall Crossing').opts(width=plot_width, height=plot_height)
    wall = format_x_axis(hv.render(wall))

    filtered_df = wt_best_last_gen_per_rep_full_results_df[wt_best_last_gen_per_rep_full_results_df.Trt == t]
    filtered_df = filtered_df[filtered_df.Task == "turn"]
    turn = create_boxwhisker_custom_ticks(filtered_df, 'Subtask', 'Fitness', f'{wt_treatment_mapping[t]} Turning').opts(width=plot_width, height=plot_height)
    turn = format_x_axis(hv.render(turn))

    plots.append([wall,turn])

# make a grid
grid = gridplot(plots)
show(grid)
