D3.js is a Javascript library that allows for data driven documents, according to the website http://d3js.org/. You can find an astounding number of examples using D3.js covering a wide variety of topics. However, when building the Evolve-a-Robot website, one of our central goals was to communicate the evolutionary process live. This meant that rather than generate plots after evolution had completed, as is often the case for offline evolutionary experiments, we wanted instead to connect the live simulation of a robot with its performance in the population.
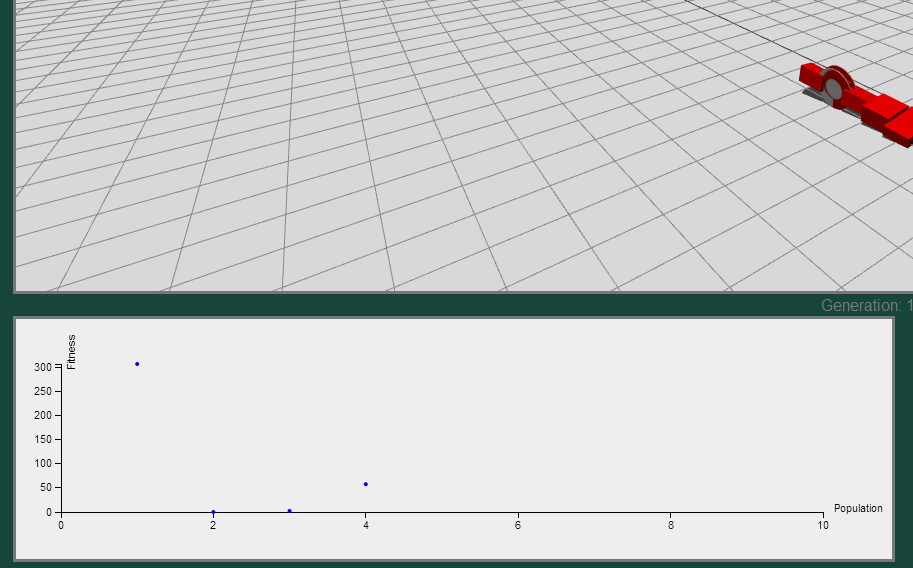
The initial scatterplot conveys the fitness of each individual in a population only after the simulation has concluded.
As a first attempt for this, I put together a scatterplot to show the progress of the current generation’s population. Initially, the scatterplot was updated at the conclusion of an individuals simulation. A dot would be added showing the individual’s id number on the x-axis and its fitness on the y-axis. However, while this communicated the progress of evolution, it did not connect the behavior seen in the simulation window with that of the plot. The ability to animate plots in D3.js shines in this situation. Accordingly, the code presented in this blog post highlights changes that can be made to a scatterplot to add the ability to update a point over the course of an individual’s simulation.
The source code for this post can be found in the following Github project under the scatterplot folder: https://github.com/jaredmoore/d3_examples
Code Organization:
A quick glance at the d3_pop_scatterplot.js file shows that the entire scatterplot code is encapsulated in an object, D3_Plotter. Inside, the code is broken down into a Generic_Scatterplot object which holds the D3 code and two other objects, gen_scatterplot and pop_scatterplot. These are associated with the two plots on the Evolve-a-Robot website. Note: The pop_scatterplot is being deprecated for a barchart in future versions. For purposes of this tutorial, I focus on the pop_scatterplot as that is live updated.
Data:
The data for this plot is intended to be the fitness of individuals in a population over the course of an evolutionary experiment. For my purposes, this plot updates while a robot is moving across various terrain. Accordingly, the fitness of a robot is defined the distance it travels from the origin. In this example, I use the following function to generate some random data:
(function addData (i) {
    var fitness_val = generateData(pop_size-i);
    setTimeout(function () {
        (function animateDataEntry(j) {
            setTimeout(function () {
            var data_to_remove = null;
            if ( j != ind_intervals ) {
                data_to_remove = [[pop_size-i,
                                   (fitness_val/ind_intervals)*(ind_intervals-(j+1)),
                                   0]];
        }
        D3_Plotter.updatePopulationScatterplot(
            [[pop_size-i,(fitness_val/ind_intervals)*(ind_intervals-j),0]],
              data_to_remove);
        if (--j) animateDataEntry(j);
    }, ind_duration/ind_intervals)
    })(ind_intervals);
    if (--i) addData(i);
    }, ind_duration)
})(pop_size);
For each individual in the population, the function generates data points simulating the progress and individual would make over the simulation time. Line 2 first generates the fitness value for the individual. The setTimeout functions then takes this fitness function and generate the intermediate points over time. As a new point is added, the old one is removed, until the full fitness value is plotted on the scatterplot.
Animation Process:
Animating the plot itself is a fairly straightforward process, although it requires keeping track of some data. For each update, two pieces of information are required, the new fitness value and the value to remove. In the Generic_Scatterplot object, I made the following changes to a D3 scatterplot to realize the animation in the plot.
// Remove data from what should be plotted on the scatterplot.
this.removeData = function(data_to_remove) {
    for(var i = fitness_data.length - 1; i >= 0; --i) {
        if (fitness_data[i][0] == data_to_remove[0][0] &&
            fitness_data[i][1] == data_to_remove[0][1]) {
                fitness_data.splice(i,1);
        }
    }
 }
D3 is data-driven, so any data in the repository is used to generate the plot. The old data to be removed has to be taken out of the data repository used to generate the plot. The new data isthen added in the updateScatterplot function. The beauty of using D3.js is that once you remove the data from the repository, provided that you have the following code in your update function, it will automatically be handled.
// Remove old
svg.selectAll("circle")
    .data(fitness_data)
    .exit()
    .remove();
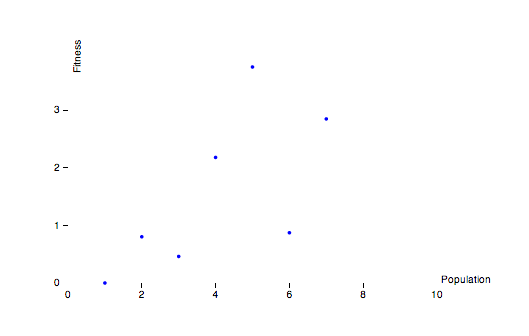
The animated scatterplot shows the final fitness of the individuals in the population. For the current individual, the point moves up from an initial fitness of 0 to a randomly defined final fitness.
Conclusion:
D3.js is a powerful tool to visualize data on the web. Especially in the evolutionary robotics domain, this can be very effective in connecting the conceptual links between simulation and evolution itself.