D3.js is a Javascript library that allows for data driven documents, according to the website http://d3js.org/. You can find an astounding number of examples using D3.js covering a wide variety of topics. However, when building the Evolve-a-Robot website, one of our central goals was to communicate the evolutionary process live. This meant that rather than generate plots after evolution had completed, as is often the case for offline evolutionary experiments, we wanted instead to connect the live simulation of a robot with its performance in the population.
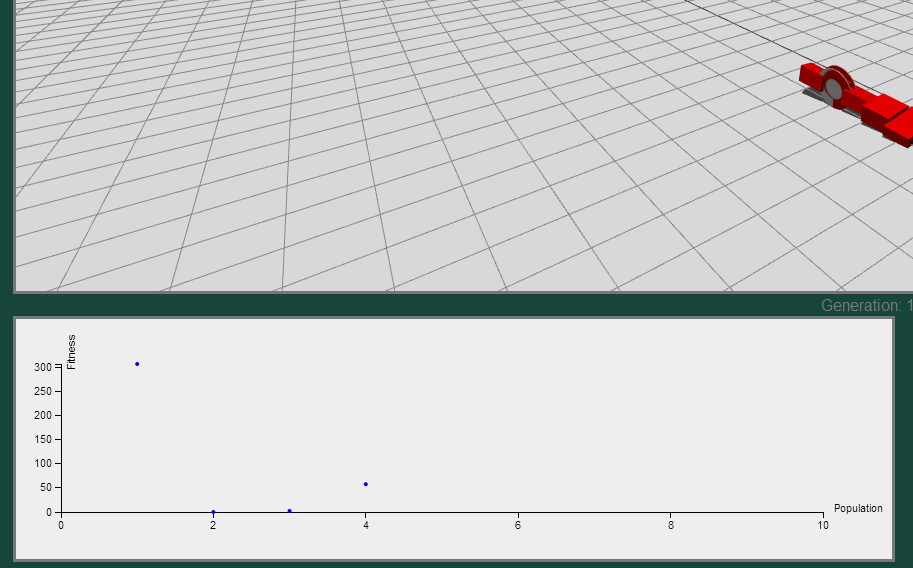
The initial scatterplot conveys the fitness of each individual in a population only after the simulation has concluded.