Author Archives: Jared Moore

ZMR250 Quadcopter: Build Overview

20141127_230715

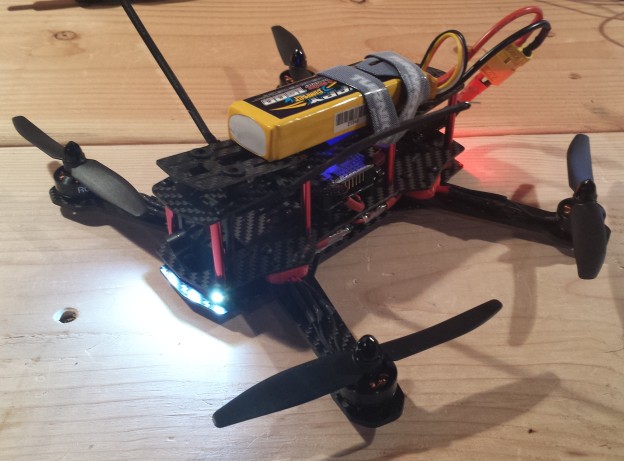
The finished ZMR250 build without FPV gear hooked up.

The ZMR250 is a quadcopter frame in the 250mm size class.  Compared to the popular DJI Phantom, the platform is significantly smaller, lighter and intended as a racing quad.  After starting out with my RCExplorer Tricopter V2 build a few years ago, I kept my eye out for a quadcopter that could easily be packed inside a briefcase for portability.  Being small and fast, the ZMR250 excels as an FPV platform for low, fast flying in an affordable and surprisingly durable platform.  In the following post, I detail a few key lessons I learned and an overview of my hardware choices.

Continue reading

Arduino: 7 Segment LED with a Shift Register

My latest apartment doesn’t have a thermometer in it.  So, like any good hacker, rather than buy a thermometer, why not build one?  7 segment LED displays can show one digit, but working with them can be a bit tricky.  In this post, I’ll show you how to setup a single digit display with an 74HC595N shift register.

Arduino Uno connected to a 7 segment LCD display through a shift register.

Arduino Uno connected to a 7 segment LED display through a shift register.

Continue reading

D3.js for Evolutionary Plotting: Animated Scatterplot

D3.js is a Javascript library that allows for data driven documents, according to the website http://d3js.org/.  You can find an astounding number of examples using D3.js covering a wide variety of topics.  However, when building the Evolve-a-Robot website, one of our central goals was to communicate the evolutionary process live.  This meant that rather than generate plots after evolution had completed, as is often the case for offline evolutionary experiments, we wanted instead to connect the live simulation of a robot with its performance in the population.

The initial scatterplot conveys the fitness of each individual in a population only after the simulation has concluded.

The initial scatterplot conveys the fitness of each individual in a population only after the simulation has concluded.

Continue reading

Getting iPython Notebook to Run “Correctly” in Mac OS X 10.8

I’m going to keep this post brief so that the steps are clear and concise.  The reason for writing this post is that I wanted to get iPython Notebook, a powerful tool for data analysis, to run with plotting and pandas in Mac OS X 10.8.  When I initially tried to get this running, I would encounter errors where there were conflicts between 32-bit and 64-bit installations of different packages.  After a good deal of trial and error, I found the following steps resulted in a full iPython Notebook environment with Pandas and Matplotlib functioning flawlessly.

Continue reading

Quick and Simple Python Web Server


If you’re ever in the need to get a quick web-server up and running, this one line python command will do wonders. Of course, launch it from the directory that your files are in.  Then you just need to go to your favorite browser and type localhost with your directory and voila!  A simple web server.

One Liner: python -m SimpleHTTPServer;

Continue reading

R Quick Tip: Use %in% to filter a data frame.

Working with R, I was looking for functionality to easily subset my data based on a sequence of numbers.  After writing a for loop and using rbind to do it initially (terrible to do in R!), I finally found a way to do this efficiently.  Using a command called %in%, you can easily apply it as a filter in the subset command to get data filtered based on your sequence.  Enjoy!

# Generate sample data based to test.
sample_data <- data.frame(ID=seq(1,100,1),
                          Score=sample(0:100,100,rep=TRUE))
summary(sample_data)

# Plot the scores, see that there is a score for each id.
plot(sample_data$Score~sample_data$ID)

# Create a filter to apply.
look_at <- seq(1,100,10)

# Filter the sample data by look_at using the %in% command.
subset_data <- subset(sample_data, ID %in% look_at)

# Plot the scores, note the filtered data.
plot(subset_data$Score~subset_data$ID)

Bash Scripts, Python, SSH and Screen: Keeping Your Jobs Alive!

I recently ran into an interesting situation that required me to run a Python script repeatedly with different inputs on a remote server.  Of course, with any SSH session, there is always the possibility of a timeout which would kill any running jobs.  Normally, I would simply deploy a program and use an & at the end of the command, allowing the job to run in the background even after I logged out of my SSH session.  Seeing that I had multiple scripts to run, and could simply adjust my inputs with a for loop, I created a bash script that repeatedly called my Python code.  This was pretty straightforward and I deployed the script with an & before logging out of my SSH session to let the job complete.

Continue reading

Starting Quirks with Pandas from an R Junkie

Okay, okay, the title might be a little sensationalised.  I have been using the R statistics package for processing the results of evolutionary runs since beginning my PhD 2 years ago.  In that time, I have become familiar with the basic process to importing data, performing basic population statistics, mean, confidence intervals, etc, and plotting using ggplot.  I’ve always felt that I could streamline the process though as I perform a great deal of preprocessing using Python.  This typically involves combining multiple replicate runs into one data file and possibly even doing some basic statistics using the built-in functionality of Python.

Continue reading

Escaping the Spreadsheet Mentality: Start with the Right Data Format

Growing up on a healthy diet of Microsoft Office products, I am well versed in Word, Excel and Powerpoint.  As I have transitioned into the research world, these products still have their place, however, I sometimes find that the habits I developed for organizing data doesn’t necessarily transfer to statistical analysis.  Recently, I ran into a situation where I was evaluating the performance of solutions in multiple different environments.  Organizing this data appeared straightforward to me at first, I would simply group the different environments into one row grouped by the id of the individual.  My data then looked something like this:

GenerationEnvironment 1Environment 2Environment 3
110.312.18.2
214.110.27.4
38.613.410.2
49.811.29.3

Continue reading